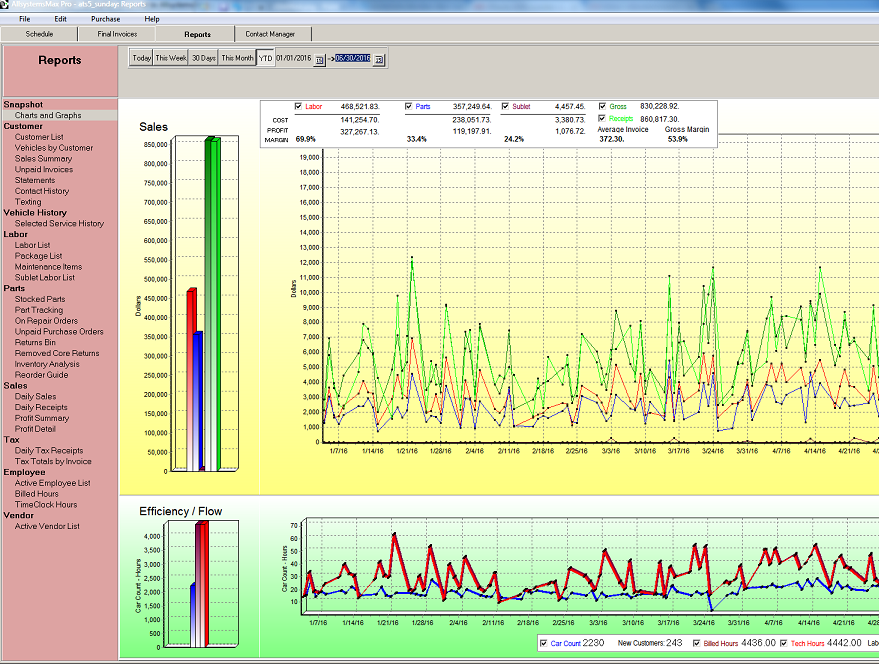
Charts and graphs will display the key indicators for your business, for the selected date range.
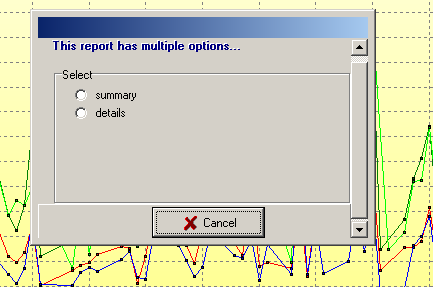
Select any of the other non-graphical reports from the column on the left. Some reports also have multiple sub-report choices.
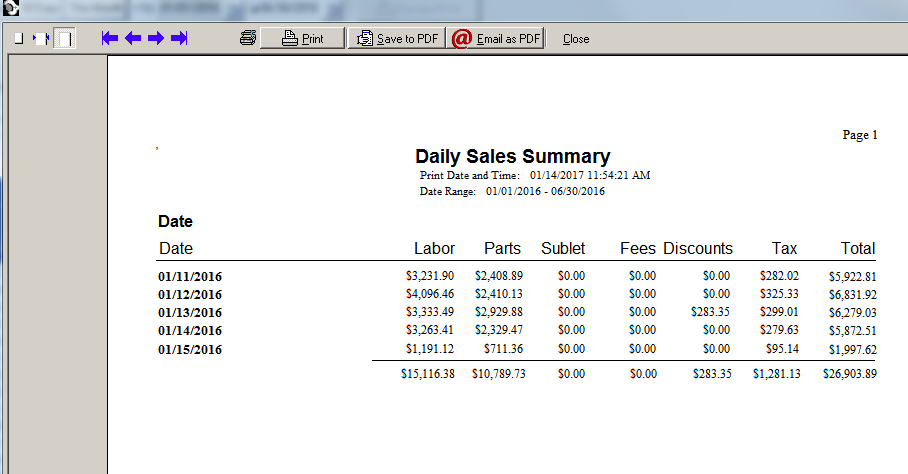
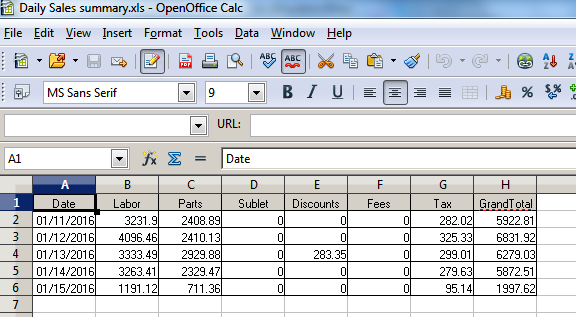
Here is a cut out from a Daily Sales Summary report:
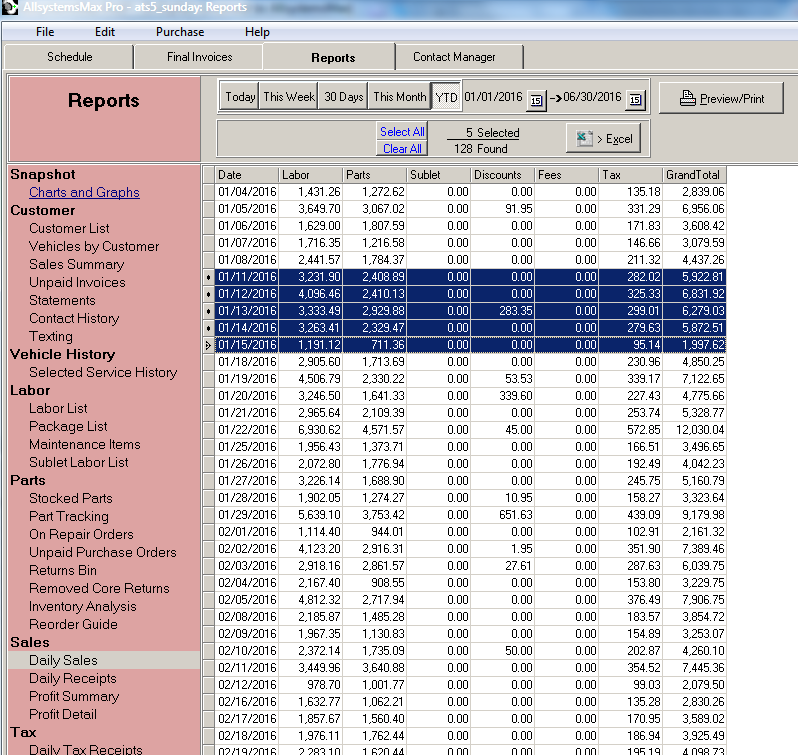
Records are selected for printing or previewing in a formatted report by clicking the 'Select All' button, or click on single lines. Hold the Control key down and continue clicking to select more lines. Or, hold the Shift key down and click the beginning of a sequence of lines, followed by a click at the end of the sequence. In the cut out above, the records for the second week of January are selected.
By clicking the Print/Preview button the formatted report is presented for viewing, printing, exporting to pdf, or emailing, the same as any other document that is displayed in Print/Preview.
Selected records can also be saved to an Excel spreadsheet by clicking the Excel button. The spreadsheet will be loaded and shown on screen.
The spreadsheet can also be saved in the File menu -> Saved Spreadsheets, with the name of your choice, for later viewing, or document sharing with others.